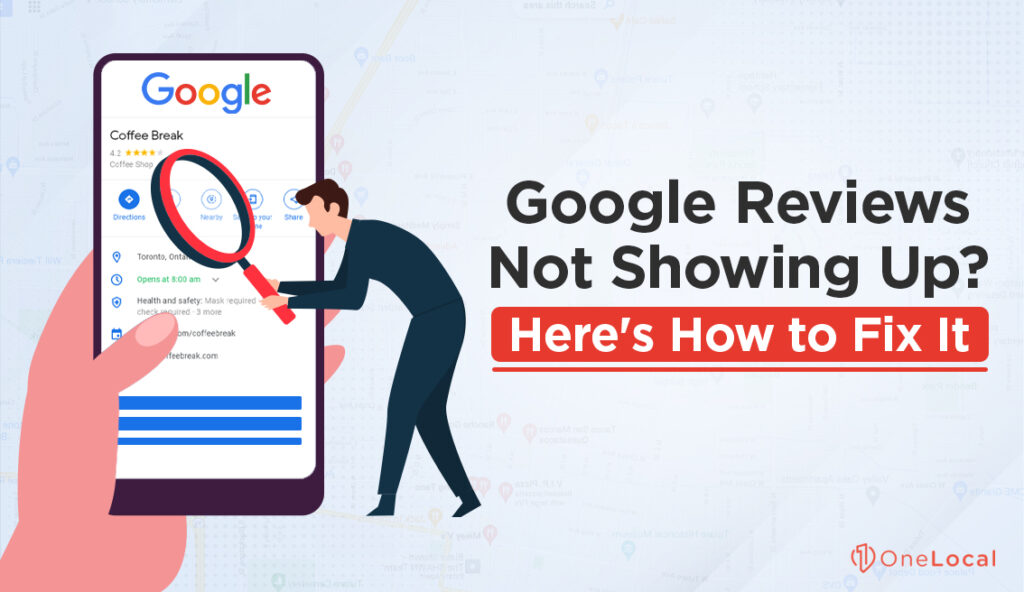
Customer satisfaction is essential to your business – pretty clear, isn’t it? You understand its significance, but what’s the next step? Here’s a single-word answer: metrics. These useful tools help us translate customer satisfaction from a vague concept into actual, useful data. This no-nonsense guide will highlight the important customer satisfaction key performance indicators (KPIs).
Let’s jump right in!
Direct Feedback and Quality of Service Metrics
It’s important to understand how your customers really feel about your product, service, or brand right at this moment. And let me tell you, direct feedback metrics are a go-to resource for those precious insights.
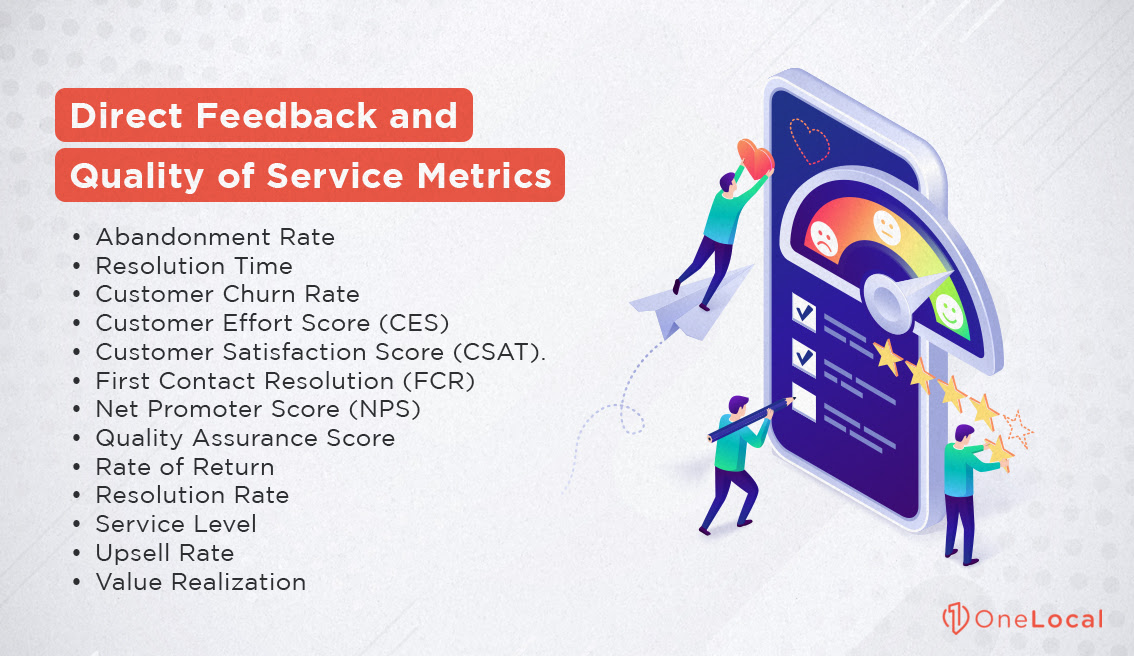
When paired with Quality of Service Metrics, they paint a full picture of just how well your business is showing up for customer needs and expectations. Just how well you are meeting the mark?
- Abandonment Rate. Assesses the percentage of customers who disconnect from your service before their issue is resolved, indicating potentially long or complicated service processes.
- Resolution Time. Pertains to the time it takes to resolve customers’ issues, from the moment they report their problem to the moment it’s resolved, with quicker resolutions leading to higher customer satisfaction.
- Customer Churn Rate. Refers to the proportion of customers who stop using your product or service over a specific time period, indicating the need for strategy reassessment when rates are high.
- Customer Effort Score (CES). Measures the ease of customer interaction and effectiveness of issue resolution using a post-interaction survey asking customers to rate the ease of their experience.
- Customer Satisfaction Score (CSAT). Gauges immediate customer satisfaction post-purchase or post-interaction, using a brief survey asking customers to rate their satisfaction with the experience.
- First Contact Resolution (FCR). Tracks if customer issues are resolved upon the first contact, enhancing customer satisfaction through efficient service.
- Net Promoter Score (NPS). Assesses customer loyalty by asking how likely they are to recommend your business, with lower scores prompting a follow-up question on how to improve.
- Quality Assurance Score. Evaluate the quality of interactions between your customer service representatives and your customers.
- Rate of Return. Measures how frequently customers use your service again, with a higher rate often signalling satisfied customers.
- Resolution Rate. Tracks the percentage of customer problems your service team successfully solves.
- Service Level. Measures the percentage of calls answered within a specified number of rings, with a higher service level suggesting prompt attention to customers.
- Upsell Rate. Measures the frequency at which your service team can upsell or cross-sell during service calls.
- Value Realization. Assesses if customers perceive they are getting their money’s worth, comparing the perceived value to cost.
Next, we’ll chat about loyalty and retention metrics.
Customer Loyalty and Retention Metrics
If you want to understand customer loyalty and retention, start by examining simple metrics like the Churn Rate, CLV, and Repeat Purchase Rate.
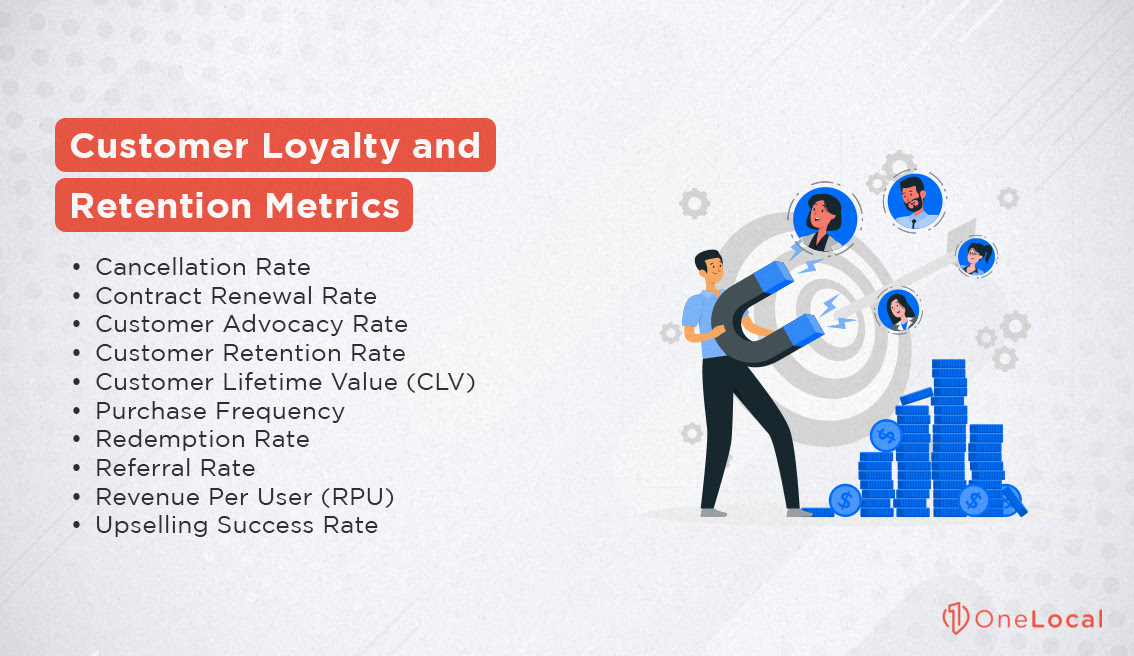
You’re on your way to digging deeper into what drives customers to stick with you:
- Cancellation Rate. Similar to Churn Rate, this metric tracks the rate at which customers cancel their subscriptions or recurring services. It’s an important indicator of customer dissatisfaction or changing needs.
- Contract Renewal Rate. For businesses with subscription-based models, this measures the rate at which customers renew their contracts, indicating long-term satisfaction and loyalty.
- Customer Advocacy Rate. This metric assesses the percentage of customers who are likely to recommend your brand to others. Is your customer service strong enough to generate word-of-mouth referrals?
- Customer Retention Rate. This metric measures the percentage of customers who remain with your business over a given period. It’s a direct indicator of how successful you are at retaining customers.
- Customer Lifetime Value (CLV). Measures the total revenue a business can expect from a single customer throughout their relationship. This is important for understanding the long-term value of maintaining customer relationships.
- Purchase Frequency. Assess the average number of purchases within a certain period. Are your customers returning for extensive purchases?
- Redemption Rate. This metric identifies the percentage of customers who use their loyalty program rewards. This can provide an insight into your reward system’s effectiveness.
- Referral Rate. Here, you measure how many of your customers came via referrals. If high, does it not mean your business is on the right track, enticing customers towards advocacy?
- Revenue Per User (RPU). By calculating the average revenue per user, you strategize your bundling or pricing policies for income optimization. Could a higher RPU mean higher profitability?
- Upselling Success Rate. Focused on the percentage of existing customers who decide to purchase a more expensive product version, its increase leads to higher revenues. Isn’t it all about strategizing the selling potential?
Keep this in mind: metrics don’t lie; they are the voice of the customer. Let’s talk about brand perception metrics next.
Brand Perception Metrics
This section is all about seeing what customers think and how they handle your brand, providing insights into how well you’re doing with your marketing tactics and connecting with customers.
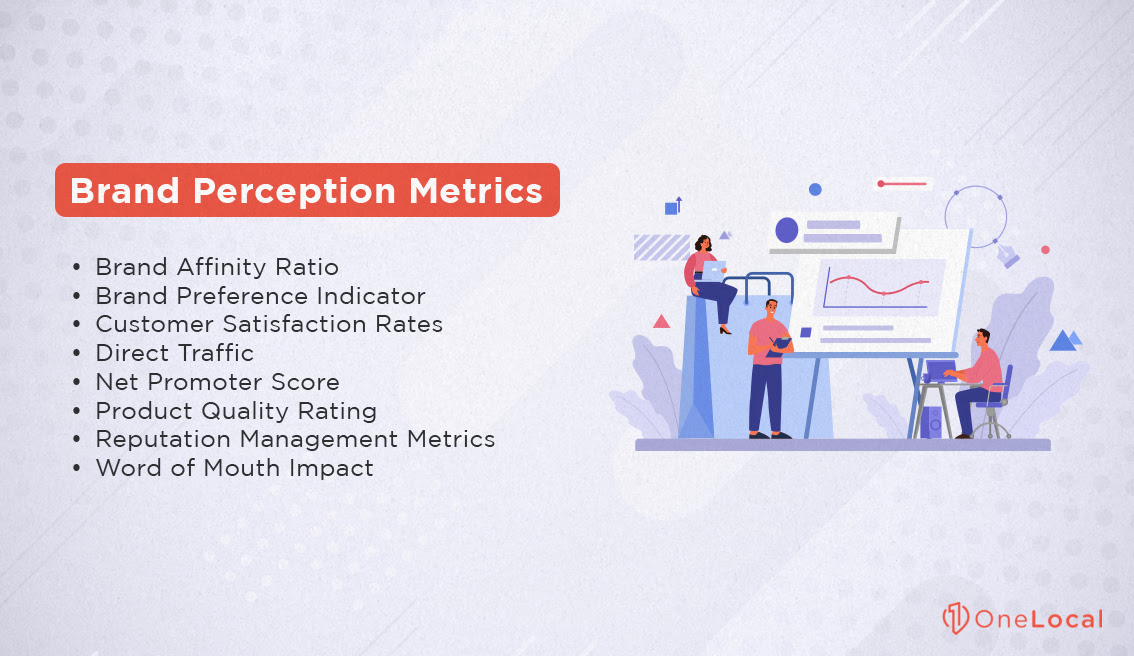
Important measures such as the brand reputation rating, how much customers participate, and what people are saying about you on social media are key. These really help you to know and guide what people think of your brand.
- Brand Affinity Ratio. Have you ever wondered about the emotional attachment people have to your brand? Measure this with the Brand Affinity Ratio, a subjective metric evaluating customers’ emotional attachment and loyalty to your brand.
- Brand Awareness Scores. Do potential customers know who you are? This metric, gathered through surveys or social media analytics, assesses the degree to which consumers recognize your brand. High brand awareness scores usually reflect larger market shares.
- Brand Preference Indicator. What’s their first choice? This metric identifies how often your brand is chosen above competitors when customers have a free choice. With a direct correlation to customer loyalty, it illustrates the pull of your brand.
- Customer Satisfaction Rates. Satisfied customers equal a prospering brand, right? This is gauged through CSAT scores, a useful metric to measure the short-term happiness of your customers, providing valuable insight into general brand perception.
- Direct Traffic. How many customers come to you directly? This SEO metric quantifies the number of people who sought your website specifically, implying pre-existing awareness and a positive perception of your brand.
- Product Quality Rating. Is your product standing up to expectations? Primarily sourced from customer reviews and surveys, this metric provides evidence of customer satisfaction linked to the quality of the product or service.
- Reputation Management These not only track your brand’s general reputation, but also decipher where you need to focus your damage control efforts.
- Word of Mouth Impact. Does positive chatter help your brand? Understand your brand’s word-of-mouth impact, a metric encapsulating reviews, recommendations, and general chatter about your brand. This can greatly impact your brand perception.
Next, let’s talk about operational efficiency metrics!
Operational Efficiency Metrics
Let’s talk about Operational Efficiency Metrics. We’re talking about those important elements enabling you to assess your customer service operations. Can your team deliver top-notch service? These metrics can help tell you.
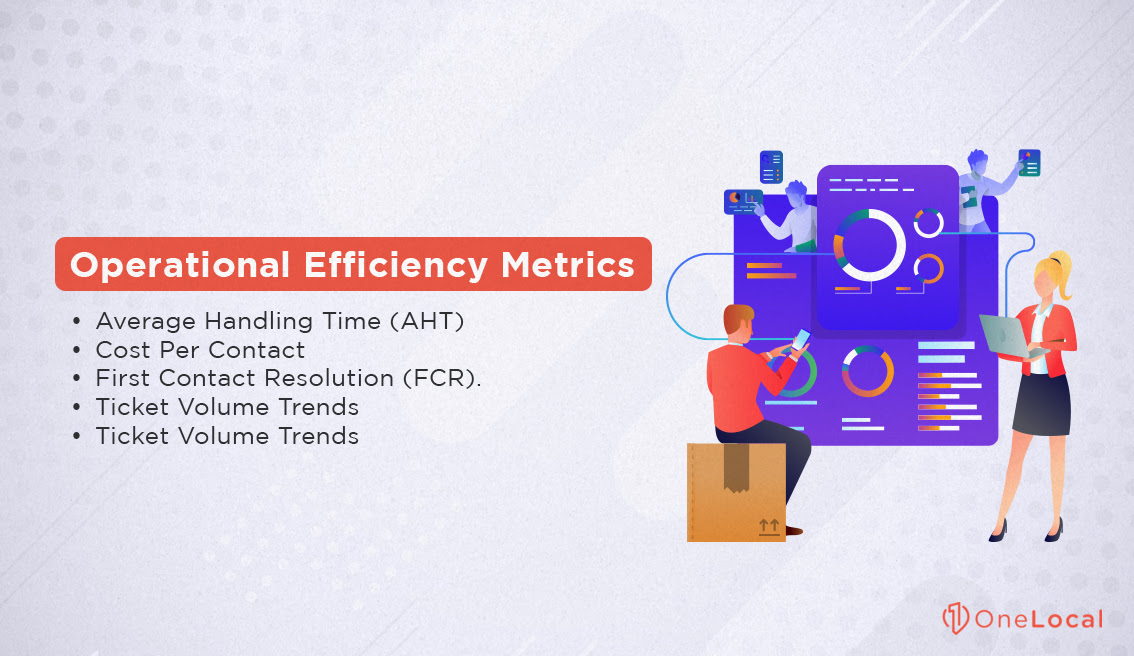
Key indicators like Average Handling Time and First Contact Resolution are worth measuring and tracking. Why? They offer a straightforward image of how your operation is performing–no frills, just facts. These metrics directly link with customer contentment. So, by keeping tabs on how we’re doing, we’re also watching out for our customers. It’s a win-win situation!
- Average Handling Time (AHT). How well does your customer service team tackle incoming queries? This KPI calculates the median duration spent on customer interactions, aiming to optimize efficiency without sacrificing service quality. It’s a delicate balance, isn’t it?
- Cost Per Contact. The Cost Per Contact KPI assesses the cost-effectiveness of each customer interaction. A lower cost can be a sign of more efficient service, but what about the quality? Keep in mind to strike a good balance between cost and quality; after all, your customer’s satisfaction should top the priority list.
- First Contact Resolution (FCR). Can you imagine how satisfying it is for customers to have their issues resolved at first contact? This metric measures the percentage of customer issues resolved during the initial interaction. Higher FCR rates usually lead to increased customer satisfaction.
- Ticket Volume Trends. Do you know how many customer service tickets your team has dealt with recently? The Ticket Volume Trends KPI helps you track this by analyzing the number of customer service queries over time. Spotting trends and anticipating resource needs becomes easier, enabling you to be proactive instead of reactive.
- Self-Service Accessibility. This KPI evaluates the effectiveness and user rate of self-service options such as FAQs, automated chatbots, and online resources via your website. Enhancing these services can lead to increased operational efficiency. Consider how the convenience and immediate response of automated services can skyrocket customer satisfaction.
Keep in mind using these KPIs to measure operational efficiency can give you a comprehensive understanding of your customer service performance and areas for improvement.
Implementing and Tracking Customer Satisfaction KPIs
Customer service relies heavily on processing information. We’ve covered a lot of potential metrics, but you need to determine which ones will truly help you understand and improve your performance.
Finding a solution to help organize your data will be a great place to start. There are lots of helpful software options ready to assist you including many CRMs and business analytics programs come with these metrics out of the box. But, finding the perfect fit for your unique needs might seem like a big challenge. The route to success is relatively simple – you just need to pinpoint software best matching your specific business needs and lining up with your company’s most important metrics.
When it comes to software, it’s not just the fancy features that count. The user-friendliness of the interface is critical to uncovering actionable data and insights. Dashboards or reports which will enable you to quickly visualize trends, threats or opportunities.
![]()
Now, let’s dig a little deeper – how your KPI changes affect your business is super important. Ever heard of A/B testing or split testing? It’s a method which enables you to put two slightly different versions of one thing head-to-head – giving you a clear picture of which one is outdoing the other. By tweaking single components at a time, you can spot the parts which either boost or harm your customer satisfaction efforts.
Communication can make or break your First Contact Resolution (FCR) rate. Think about using the split testing method to switch up your communication techniques and monitor the results. Are you serious about the Customer Effort Score (CES)? Change a single component of your customer service approach and then watch closely as this change shakes things up. It’s not just about making things better, but also keeping a keen eye on how things are progressing. If everything goes according to plan, you should start seeing the fruits of your labor.
Improve Your Customer Communications
Simply meeting customer expectations won’t cut it. To truly stand out, you need high-quality customer service and loads of interaction. This is where a solution like LocalMessages comes into play. Think of this messaging platform as the right word at the perfect time—spurring better connections with your key customers. It’s all in the timing.
Ever think about reaching your customers in a way they’ll find straightforward and easy? That’s a surefire way to lift engagement and boost your business and this is what you get with LocalMessages. With its swift text replies to customer queries, your brand makes sure it’s always in the loop. An overwhelming 80% of customers gravitate towards text communication with businesses – it’s direct, personal, and never feels pushy.
Rapid response is very important to customer engagement. You wouldn’t believe this, but about 90% of text messages are read within a mere three minutes. That makes texting the quickest customer engagement method. But there’s more – editable templates, automated message response, and robust analytics are just a few added perks offered by LocalMessages. But it doesn’t just close the gap in instant responses – it also helps you dig into your customers’ needs better.
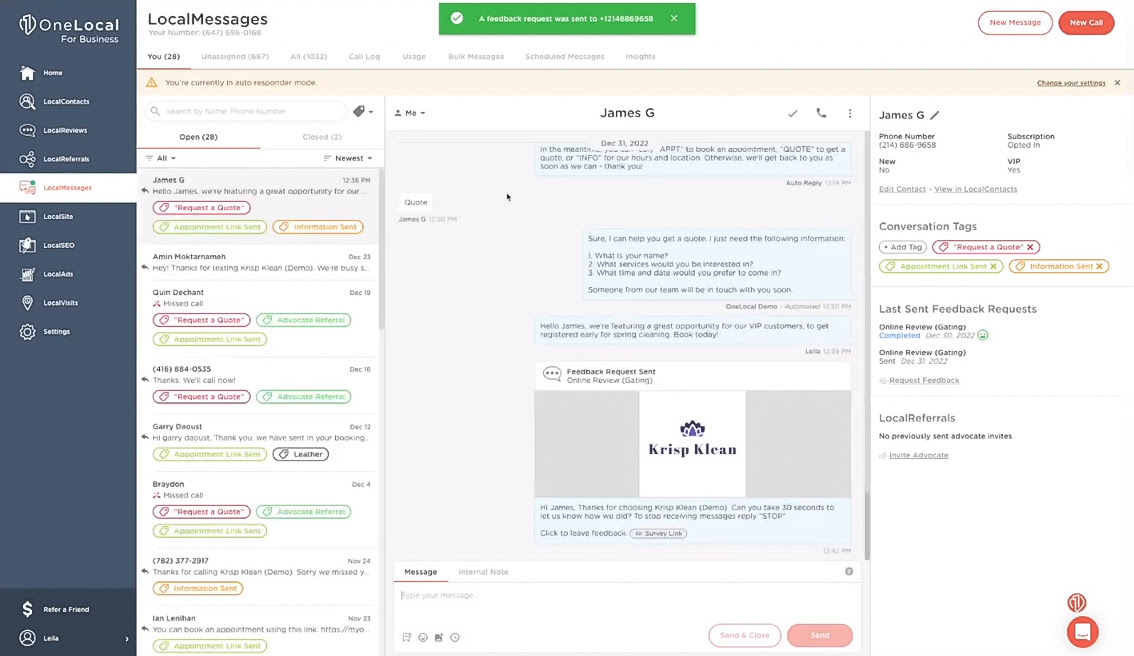
Imagine sending tailored reminders, review requests and birthday wishes or using AI to smartly generate promotional, informational or educational text messages. All of these features are standard with the LocalMessages platform.
Every business is unique and so are its communication needs. So, if you’re looking for outstanding customer service and regular growth, LocalMessages is a worthy contender. Don’t just take our word for it, though – why not request a demo today? Bid farewell to missed message or calls. It’s about time you took control of your conversations.

Rachel Solway is a seasoned marketing professional dedicated to empowering small businesses through innovative marketing strategies. With extensive experience at OneLocal, a leading marketing solutions provider, Rachel’s insights are helping thousands of local businesses navigate the digital landscape.